The Made-Up Nonsense of the Trump Tariff Calculations
Article
research
Published: 04/07/2025
Read Time: 4 min
0:00
Overly simple formula hits poor countries hardest
I had a look at the Trump tariff formula. You may have assumed it was a complex calculation based on evaluating tariff and non-tariff barriers to trade – a difficult endeavor no doubt. If you assumed that, you would be wrong.
The actual calculation is quite simply the dollar trade deficit divided by the value of exports to the US. Nearly all of the highest tariff countries are quite poor and are primarily export nations that provide affordable goods to the developed world and jobs and revenue to the developing world. Adam Smith 101, comparative advantage.
As always, feedback welcome.
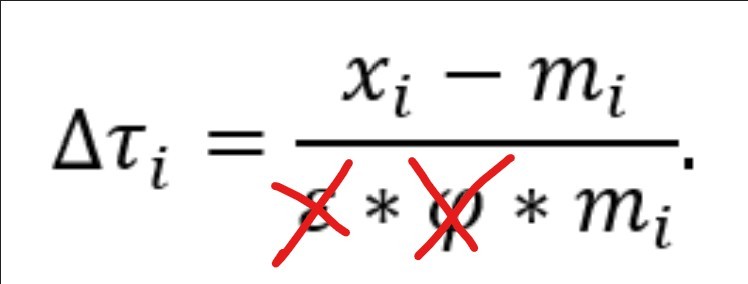
In order to give the calculation a patina of economic gravitas, the formula is peppered with Greek letters and complex economic terms such as elasticity. The additional Greeks actually cancel each other out and don't impact the calculation at all.
I had a look at the Trump tariff formula. You may have assumed it was a complex calculation based on evaluating tariff and non-tariff barriers to trade – a difficult endeavor no doubt. If you assumed that, you would be wrong.
The actual calculation is quite simply the dollar trade deficit divided by the value of exports to the US. Nearly all of the highest tariff countries are quite poor and are primarily export nations that provide affordable goods to the developed world and jobs and revenue to the developing world. Adam Smith 101, comparative advantage.
As always, feedback welcome.
In order to give the calculation a patina of economic gravitas, the formula is peppered with Greek letters and complex economic terms such as elasticity. The additional Greeks actually cancel each other out and don't impact the calculation at all.

Take Bangladesh for example. The US has imposed a 37% tariff based on a 74% trade deficit. It’s obvious that Bangladesh would be a net deficit country as the average income in Bangladesh is very low (e.g. garment workers earn less than $1 hour in Bangladesh) and so it is natural that they will leverage their lower labor costs to produce goods to export to the world. In fact, Bangladesh’s ready-made garment sector has been a critical factor elevating Bangladesh from amongst the poorest countries in the world. In 2024 Bangladesh exported over $7B in textiles to the US.
In total, Bangladesh exported $8.4B to the US and imported $2.2B from the US, leaving a trade deficit of $6.2B or 74% of $8.4B. Divide that by 2 and you arrive at the 37% Trump tariff. As noted, the Greek letters further multiply the result by ¼ and 4, but basic middle-school math reveals that those numbers cancel.
Bangladesh, based on other reports, has an actual weighted average tariff with the US closer to 13%. That would imply that the “generous” tariff of 37% isn’t half the actual tariff rate but in fact 3x the actual.
What are the chances that the US tariffs will result in the US replacing Bangladesh’s ability to mass produce affordable cloths? Zero. What are the chances that the US tariffs reverse the progress Bangladesh has made? Very high.
It’s not just Bangladesh. As shown in the chart below nearly all the high tariff countries are low-income countries. 100% of countries with a Trump tariff rate over 35% had an average annual salary less than $10K. The only two countries with Trump tariffs over 30% and an average salary over $10K are Taiwan and Switzerland. Their deficits are largely a function of punching above their weight in manufacturing.
The bulk of Taiwan’s deficit is due to semiconductor exports to the US (and most of that is attributed to Semiconductor powerhouse TSMC). And Switzerland excels in healthcare exports and (no surprise) watches, clocks and precious metals.
